
Remittance costs in South Asia: who pays the 6% tax on migrant wages
More than 10 million Bangladeshis work abroad and sent home a record $35.6 billion in fiscal 2025-26 (Bangladesh Bank). Every transfer carries a fee, a currency spread and, often, a trip to an agent.
The cheapest region on the world’s remittance tables still leaves billions on the counter. Here is where it goes.
Remittance costs in South Asia look modest on global league tables. The region is one of the cheapest places in the world to receive money. But averages hide the corridors that matter most, the fees paid in cash at the sending end, and the volume still moving through informal hundi networks.
This deep dive breaks down where the cost of a remittance actually comes from, why informal channels keep winning, and which product could take the fees out of migrant wages for good.
The scale of the flows
Remittances to low- and middle-income countries reached an estimated $685 billion in 2024, more than foreign direct investment and official aid combined. South Asia led growth at 11.8%, driven by India, Pakistan and Bangladesh.
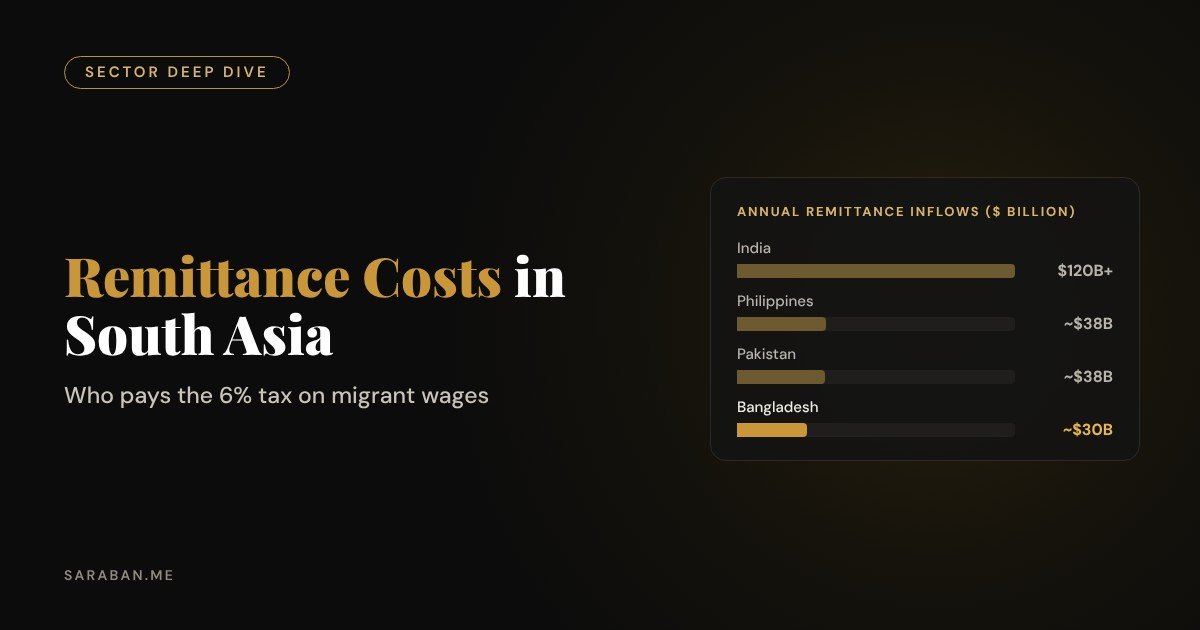
| Country | Approximate annual inflows | Main sending corridors |
|---|---|---|
| India | Over $120 billion | Gulf, United States, United Kingdom |
| Philippines | About $38 billion (2024) | United States, Gulf, Singapore |
| Pakistan | $30-38 billion (record in fiscal 2024-25) | Saudi Arabia, UAE, United Kingdom |
| Bangladesh | $35.6 billion (record in fiscal 2025-26) | Saudi Arabia, UAE, Malaysia, United States |
| Indonesia | About $15 billion | Malaysia, Saudi Arabia, Taiwan, Hong Kong |
Where remittance costs in South Asia really come from
The World Bank tracks the total cost of sending $200, including fees and the exchange-rate margin. The global average sits around 6.4%, more than double the UN’s 3% target. South Asian corridors are often cheaper than that average, yet the true cost to a worker is usually higher than the headline.
| Cost layer | What the worker sees | Typical impact |
|---|---|---|
| Transfer fee | A flat charge at the counter | Large share of small transfers |
| Exchange-rate margin | A worse rate than the market rate | Often 1-3% and rarely shown |
| Cash-out cost at home | Travel or agent fees to collect cash | Paid by the family |
| Time cost | Hours spent visiting an agent on a day off | Lost wages |
For a worker in Saudi Arabia earning about $400 a month and sending $350, a few percentage points is a week’s groceries. Multiply it across a country and remittance costs become one of the largest consumer fees in the economy.
Why informal channels still win
Hundi and hawala networks move a large share of South Asian remittances outside the formal system. They are illegal in many cases, but they persist for practical reasons.
Informal channel
Fast and cheap
Better rate, door-to-door delivery, no paperwork, open on Fridays.
Formal agent
Slower and costlier
ID checks, posted rates with a margin, limited hours, cash pick-up at home.
When the black market beats the formal market on price and speed, the problem is product design, not just enforcement. Governments in Bangladesh and Pakistan have used cash incentives on formal transfers to shift behaviour, and inflows rose when they did.
The product that removes the fee
Digital players such as Wise have shown that cross-border transfers can be done for well under 1%. The technology is solved. The missing piece is distribution: reaching the worker at the moment wages arrive, before the agent does.
- Salary paid into a digital wallet through the employer or recruitment agency.
- One-tap transfer home at a transparent, low rate.
- Earned wage access so the worker is not forced into informal loans before payday.
- Micro-savings and insurance for the worker and the family at home.
Why payroll is the moat
The company that holds the payroll relationship sees income before anyone else. It can offer remittance, credit and savings from one account, at a customer acquisition cost no consumer app can match.
We look at this model in more detail in our analysis of the Gulf to Bangladesh corridor.
How remittance costs in South Asia could fall further
| Lever | Who controls it | Effect |
|---|---|---|
| Real-time payment links between countries | Central banks | Cheaper, instant settlement |
| Digital wallets at the receiving end | Mobile money providers | No cash-out trip for families |
| Payroll-integrated transfers | Employers and fintechs | Lower acquisition cost, better rates |
| Rate transparency rules | Regulators | Exposes hidden exchange margins |
Policy has already shown what is possible. When Bangladesh and Pakistan paid a small cash incentive on remittances sent through formal channels, recorded inflows jumped, which suggests that much of the money had been moving informally rather than not moving at all. Incentives are expensive for governments, though. Lowering remittance costs in South Asia through better products is the more durable fix, because it makes the formal route the cheapest one without a subsidy.
The technology to send money home for under 1% already exists. What is missing is a product that reaches the worker on payday, before the agent does.
Frequently asked questions
How much does it cost to send money to South Asia?
The World Bank’s global average for sending $200 is around 6.4%. South Asian corridors are often cheaper, but exchange-rate margins, cash-out costs and informal channels mean the real cost to workers is frequently higher.
What is the UN target for remittance costs?
Sustainable Development Goal 10.c aims to reduce remittance transaction costs to below 3% and eliminate corridors costing more than 5% by 2030.
Why do migrants still use hundi?
Informal channels often offer better exchange rates, door-to-door delivery and no paperwork, which can make them faster and cheaper than formal agents.
Which corridor gets the first payroll-integrated remittance product at scale: Gulf to Bangladesh, Gulf to the Philippines, or intra-Southeast Asia?
Share your view in the comments. This post is part of a 50-part series on fintech in South and Southeast Asia; see the full series index.
Keep reading
Sources
This article is for information and education only. It is not investment, legal or tax advice, and it is not an offer to sell, or a solicitation of an offer to buy, any security or interest in any fund. Market figures come from the third-party sources listed and may change; please check the original sources.